Observe and control
Now that your application is connected to the AI Gateway, you should be able to see requests coming in through your Cloudflare Dashboard - AI Gateway. This guide shows you what data you can expect to see and what settings to configure for better control.
Analytics
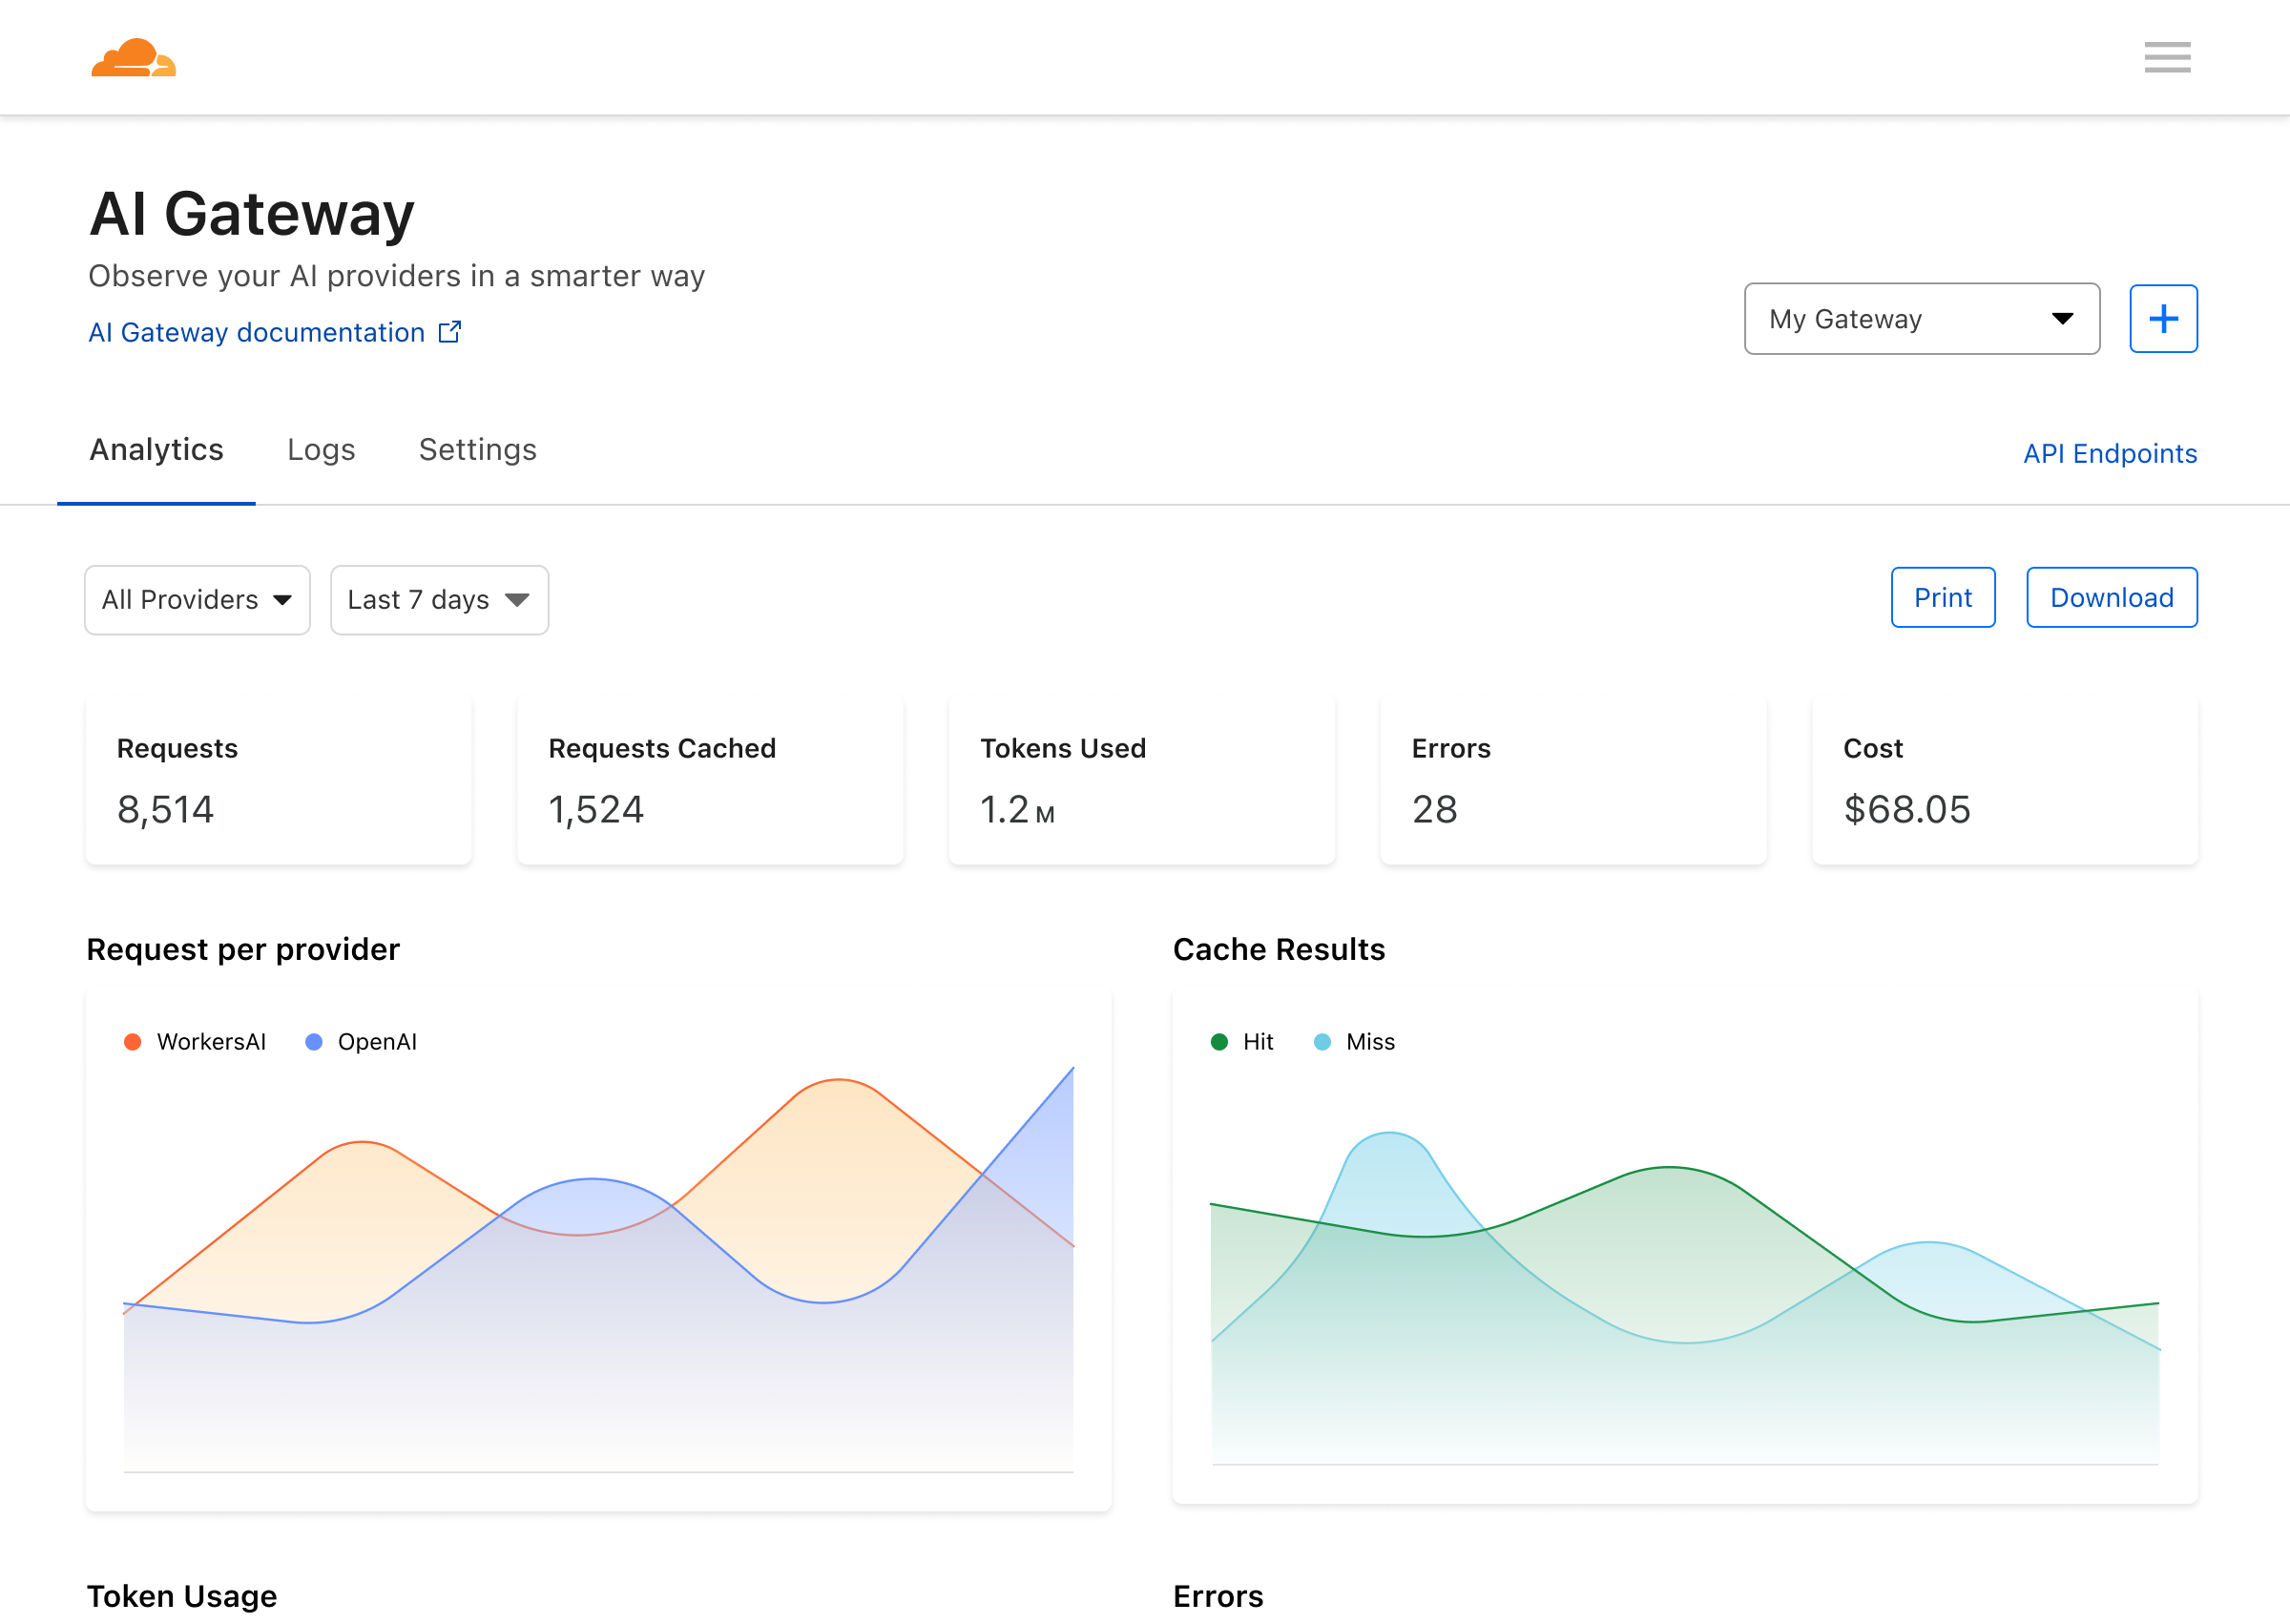
On the first page of your AI Gateway dashboard you’ll see metrics on requests, tokens, caching, errors, and cost. You can filter these metrics by time and provider-type.

Using GraphQL
You can use GraphQL to query your usage data outside of the AI Gateway dashboard. See the example query below. You will need to use your Cloudflare token when making the request, and change ACCOUNT_TAG to match your account tag.
Requestcurl --request POST \  --url https://api.cloudflare.com/client/v4/graphql \  --header 'Authorization: Bearer TOKEN \  --header 'Content-Type: application/json' \  --data '{    "query": "query{\n  viewer {\n	accounts(filter: { accountTag: \"ACCOUNT_TAG\" }) {\n	requests: aiGatewayRequestsAdaptiveGroups(\n    	limit: $limit\n    	filter: { datetimeHour_geq: $start, datetimeHour_leq: $end }\n    	orderBy: [datetimeMinute_ASC]\n  	) {\n    	count,\n    	dimensions {\n        	model,\n        	provider,\n        	gateway,\n        	ts: datetimeMinute\n    	}\n    	\n  	}\n    	\n	}\n  }\n}",    "variables": {   	 "limit": 1000,   	 "start": "2023-09-01T10:00:00.0Z",   	 "end": "2023-09-30T10:00:00.0Z",   	 "orderBy": "date_ASC"    }
}' Logging
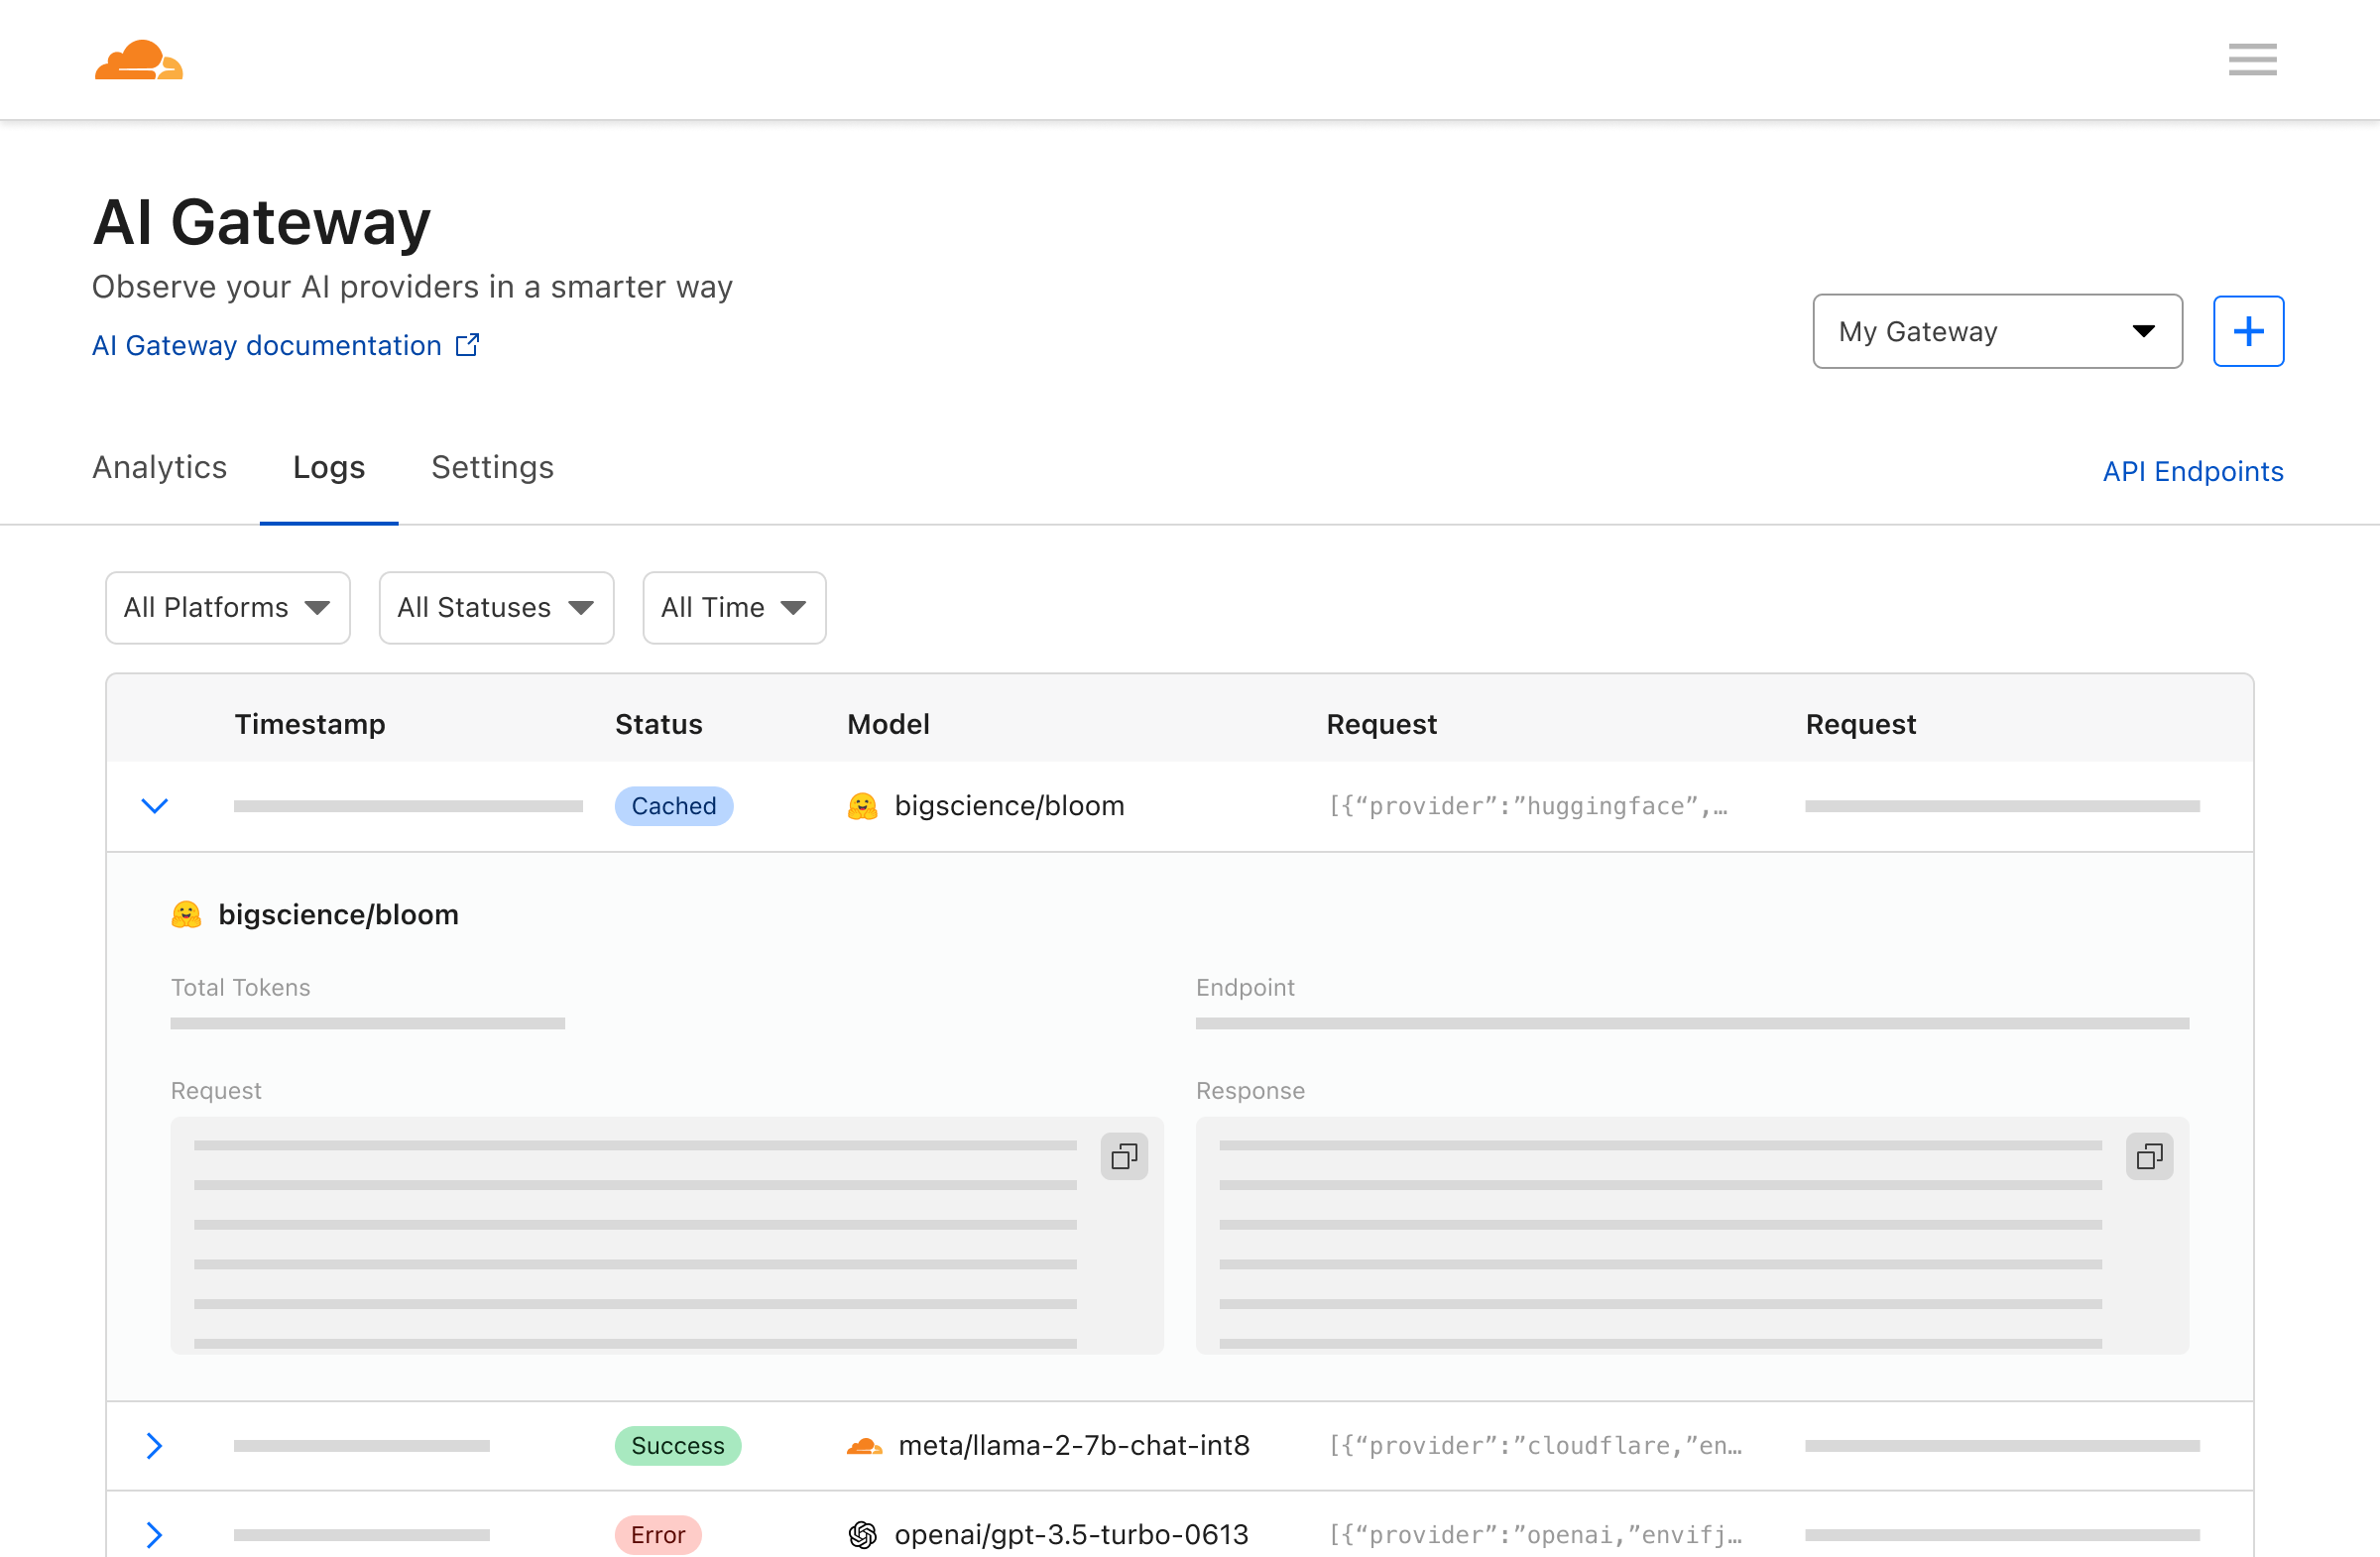
The second tab in the dashboard will take you to the logging page. Here you can see individual requests, such as the prompt, response, provider, timestamps, and whether the request was successful, cached, or if there was an error.

Settings
On the third tab of the dashboard, you can see settings for your gateway.
Caching
You can enable caching so requests are served from our cache rather than the original provider. This can help you keep costs down and provide faster responses for your users.
You can define the Time to Live (TTL) for caching, which is how long the cache is kept for before needing to query the original API again. For example, if I set a TTL of 1 hour, it means that a request is kept in the cache for an hour. Within that hour, an identical request will be served from the cache instead of the original API. After an hour, the cache expires and the request will go to the original API for a “more recent” response and that response will repopulate the cache for the next hour.
Rate limiting
Rate limiting is helpful when you want to control the traffic your application gets. If you are concerned about expensive bills or suspicious activity, rate limiting can help cap spending and activity by limiting requests.
You can define rate limits as the number of requests that get sent in a specific time frame. For example, I can limit my application to 100 requests per 60s.
You can also select if you would like a fixed or sliding rate limiting technique. With rate limiting, we allow a certain number of requests within a window of time. If it’s fixed, the window would be based on time, so there would be no more than x requests in a 10 minute window (for example). If it’s sliding, there would be no more than x requests in the last 10 minutes.
To illustrate this, let’s say you had a limit of 10 requests per 10 minutes, starting at 12:00 so the fixed window is 12:00-12:10, 12:10-12:20, etc. If you sent 10 requests at 12:09 and 10 requests at 12:11, all 20 requests would be successful in a fixed window strategy, but would fail in a sliding window strategy since there were >10 requests in the last 10 minutes.
Editing your gateway
You can also delete and rename your gateway or the endpoint. Please note that by editing your gateway endpoint (not the gateway name in the dashboard), you’ll need to update the endpoints in your code to reflect the updated changes.
Deleting your gateway is permanent and can not be undone.